| Overall | 13W 6L 0T |
| District | 9W 3L 0T |
| Expected | 17: 0+ 2- |
":" = Games won or lost as expected,
"+" = Games won against stronger team,
"-" = Games lost against weaker team)
|
19 3 2 Rank in State, Class, District |
1186 14 Strength Momentum |
1031 56.9(19) SOS, RPI(RPI Rank) |
":" = Games won or lost as expected, "+" = Games won against stronger team, "-" = Games lost against weaker team) | |
| Date | Opponent1 | RGWF4 | Opp Strength | Result | Expectation2 | Playing Strength | P(Win)3 | Send |
|---|---|---|---|---|---|---|---|---|
| 08/25/15 | Belen | 0.003 | 1170 | W 4- 3 | Expected (+1) | 1212 | 56% |  |
| 08/27/15 | St. Pius | 0.002 | 1282 | L 0- 6 | Expected (-5) | 914 | 41% | |
| 09/01/15 | at East Mountain | 0.007 | 1024 | W 5- 1 | Expected (+3) | 1322 | 67% | |
| 09/04/15 | St. Michael's ? | 0.019 | 1182 | L 1- 2 | Worse (-1) | 1118 | 55% | |
| 09/08/15 | at Albuquerque | 0.034 | 1475 | L 1- 3 | Expected (+1) | 1246 | 14% | |
| 09/11/15 | Bloomfield | 0.011 | 761 | W 9- 0 | Expected (+4) | 1422 | 95% | |
| 09/15/15 | Bosque ?? | 0.086 | 1089 | L 0- 1 | Worse (-2) | 1072 | 67% | |
| 09/17/15 | Kirtland Central ! | 0.016 | 893 | W 10- 0 | Expected (+7) | 1544 | 87% | |
| 09/22/15 | Rehoboth Christian | 0.041 | 802 | W 9- 0 | Expected (+5) | 1442 | 93% | |
| 09/25/15 | Piedra Vista | 0.235 | 1031 | W 5- 2 | Expected (+1) | 1243 | 74% | |
| 09/26/15 | Hobbs !! | 0.225 | 1197 | W 5- 1 | Expected (+4) | 1377 | 53% | |
| 10/01/15 | Navajo Prep | 0.060 | 506 | W 10- 0 | Expected (+3) | 1350 | 100% | |
| 10/02/15 | at Kirtland Central | 0.348 | 893 | W 4- 1 | Expected (0) | 1206 | 82% | |
| 10/07/15 | at Hope Christian | 0.608 | 1348 | L 2- 4 | Expected (0) | 1183 | 25% | |
| 10/13/15 | at Bosque | 0.780 | 1089 | W 3- 2 | Expected (0) | 1204 | 59% | |
| 10/15/15 | at Rehoboth Christian | 0.166 | 802 | W 9- 1 | Expected (+4) | 1420 | 89% | |
| 10/22/15 | at Navajo Prep | 0.187 | 506 | W 8- 0 | Expected (+2) | 1272 | 99% | |
| 10/23/15 | at Bloomfield | 0.491 | 761 | W 5- 0 | Expected (+1) | 1242 | 92% | |
| 10/24/15 | Hope Christian | 0.745 | 1348 | L 0- 3 | Expected (-2) | 1100 | 33% | |
|
Notes: 1Games against an opponent in the same district are shown in bold letters; may NOT be an actual district game Numbers in parentheses for reported games are the goals Sandia Prep actually scored, relative to what ratings predicted 2Numbers listed for unreported/future games are the most probable winning margin 3P(Win) is the expected winning Percentage -- the statistical success rate for predicting the game winner between teams of this strength difference 4RGWF is the relative weight factor for this game * Game at a neutral site, or unable to determine which team gets home field advantage |
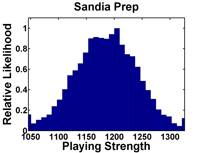
The median opponent strength is 1031, while
Sandia Prep's "weighted playing strength" is 1214
(where a win by 4 goals counts 0.70 as much as a 1 goal win, and
a game played on 10/03/15 counts 0.5 that of one played on 10/24/15)
Go back to ratings for Boys Varsity Girls Varsity Main Page